
We live in a new age of quality content. In direct response to the technology evolution over the past decade, audiences are consuming information in new ways, from smaller, more portable screens on mobile devices to third-party apps and discovery platforms. The result has been a shift in content consumption preferences, and 91% of consumers now prefer interactive and visual content over traditional, text-based, or static media.[1] What does it mean? Are people tired of reading today? This is a frequently asked question and the question is reasonable because with every passing year even the moderately web literate people demand to see innovative things that catch the eye and gravities eyeballs right there. That‘s why the website designs are getting more posh.
Information today takes many forms and easily accessible. People are suffering information overload in all life spheres, especially when it comes to large texts. Children in most instances don’t like reading. “It’s going to take a lot of time.” Time… It’s another reason why people tend to read less. Why spend time for reading when information can be perceived in another way and save precious hours?! That’s why audiobooks became so popular and a movie based on the book is often more popular and more famous than the original story. How many actually read ‘The Lord of the Rings’ or ‘Game of Thrones’ books before the movie or TV show had emerged? The answer is obvious.
According to Josh Schwartz, a data scientist at the traffic analysis firm Chart beat visuality, today is the best way to deliver most of your precious thoughts to the audience. The human mind tends to perceive information in images.[2]
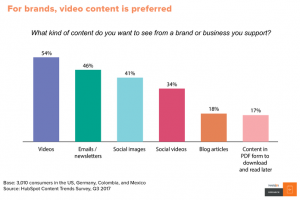
Videos have become powerful tools for brands. Globally in 2018, YouTube is consumers’ leading source of video content, at 83%, shows a graphic below, based on Hubspot Research:[3]
Video continues to be one of the most effective elements in a digital marketing strategy at moment also. Consumers find video content more engaging, more memorable, and more popular than any other type of content out there. Video as a means of storytelling and advertising is no longer a nice option – it’s a necessity.
Seeing is believing for most of the consumers of information. Today the sentence “A picture is worth a thousand words” has never been more true with the creation of social media platforms providing visual content today like Instagram, YouTube, Pinterest, Flickr, and We Heart it… the number of users has grown steadily in the past years. If yesterdays runways were the main sources of inspiration, today social networks create the beauty trends of tomorrow! Visuality is imposed since July 25, 1925, when a newspaper Washington Post publishes an article with the same insight “A picture is worth a thousand words”.
More often than not, we visualize a blog post that contains a few complimentary images. Visual content – infographics, memes, images, videos, graphs – enables us to engage our target audience through more channels.
Visual content is effective because of the way our brains work. Physiologically this is assumed. Our brains can process visual information 60,000 times faster than it takes to decode text. It takes one-tenth of a second (1/10) for our brain to process visual prompts. The average consumer has an attention span of about 8 seconds, leaving you with a very short window to capture their interest. That is very useful for visual content marketing. The big challenge for marketing specialists is to find a creative way to display your information instead of using plain text and bullet points. Images associated with an object are interpreted at a faster rate than text associated with an object. When a visual cue is identified or when an image draws an emotional appeal, our brain is able to make rapid connections to the already-stored information within our memory. This allows our brain to retain information longer and more efficiently.
The effectiveness of advertisement today depends on visual content. For example, Ariel exaggerates to communicate the message. Ariel makes the person’s shirt so white in this ad by Saach&Saachi that the shadow is blocked.

Agency Network: Saatchi & Saatchi
Coca-Cola provides their audience with fun, colorful and quirky visuals that are easy to like and share. There are many examples and all of them need visual content to capture the target audience’s attention.

Bluetongue…Coca Cola
It’s predicted that by 2021, video content will account for almost 82 % of internet traffic, making it an ideal format for marketers to disperse a narrative to a desired audience.[4] And Stanford’s study on web credibility found that most users admit to making judgments about a brand’s credibility based on website design.[5] . Visual content becomes the first component of the strategy of many brands and publishers in a sustainable way. For example, the popular brand Glamour recently redesigned its online arm and mobile app to embrace a new focus on creating a visual impact over-prioritizing the latest news. Online editions of brands as Glamour generate more audience and visual content can increase social media presence because visual content plays much better to the social media audience.
In the ocean of information and overwhelming of that information it seems the decision is visualization, which helps us to see more structures and connections. The way in which we relate to information depends on how it is designed, says David McCandless, journalist, author of both bestselling infographic books “Knowledge is Beautiful”, and “Information is beautiful”. He makes infographics – a simple way to tease out unseen patterns and to see the information that might be too complex or too big believing that the way in which we relate to information depends on how it is designed. Through visualization is possible to see more patterns. All his visualizations based on facts and data helping viewers to make more informed decisions about the dynamic world where we live. [6] During Davis McCandless TED Talk he concerns the relative effect of conversion of human senses to computer terms or the so-called “Bandwidth of Senses” infographic. The conversion is a diagram by Danish Physicist Tor Norretranders.[7] It demonstrates why visualizations are so effective in conveying huge amounts of information in split seconds. The visual info has the same bandwidth as computer networks. The touch is as fast as USB. Hearing and smell are as fast as a hard drive. The good old taste is at the level of the pocket calculator. But the awareness is the smallest percentage – 0.7.
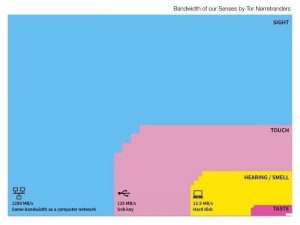
The bandwidth of our senses by Tor Norretranders
Thereby, the diagram shows the power of vision compared to our other senses. It demonstrates why visualizations are so effective in conveying huge amounts of information in split seconds. Oh, and by the way, the white spot on the right lower corner is when we become conscious of what we just sensed. But one of the most important conclusions of David McCandless is that the database changes our thinking. “I feel that every day all of us now are being blasted by information design it’s being poured into our eyes through the web and we’re all visualizes now we’re all demanding a visual aspect to our information and there’s something almost quite magical,” says McCandless.[8]
The problem is the growing privatization of information. The world economy is rapidly becoming an information economy. Information is a commodity and can be bought and sold. There is a danger of new “rich in information” and “information poor” classes. Information also affects the standard of living and the knowledge gap is widening.
References:
- Anderson, Brian. “B2B Marketers Leverage Interactive Content For Relevant Buyer Experiences”, August 19, 2015. https://www.demandgenreport.com/features/industry-insights/b2b-marketers-leverage-interactive-content-for-relevant-buyer-experiences
- “55 video marketing statistics for 2019”. https://biteable.com/blog/tips/video-marketing-statistics/
- Dayan, Zohar. “Visual Content: The Future of Storytelling”, April 2, 2018. https://www.forbes.com/sites/forbestechcouncil/2018/04/02/visual-content-the-future-of-storytelling/#78c7ccfd3a46
- League, Aby Nicole .” Visual Content Marketing: Why It Is Matters and How It Differs From Content Writing”, May 24, 2018, Relevance Content Promotion News &Insights. https://www.relevance.com/visual-content-marketing-why-it-matters-and-how-it-differs-from-content-writing/
- McCandless, David. „The beauty of data visualization”, TED Global 2010. https://www.ted.com/talks/david_mccandless_the_beauty_of_data_visualization
- MOTO CMS Editorial. “Visual Website Designs – Are People Tired of Reading?”, https://www.motocms.com/blog/en/visual-website-designs/
[1] Brian Anderson, B2B Marketers Leverage Interactive Content For Relevant Buyer Experiences, August 19, 2015. https://www.demandgenreport.com/features/industry-insights/b2b-marketers-leverage-interactive-content-for-relevant-buyer-experiences
[2] Meet Chart beat for digital Publishing, https://chartbeat.com/
[3] https://research.hubspot.com/charts/branded-video-is-preferred
[4] Zohar Dayan, Visual Content: The Future of Storytelling, April 2, 2018. https://www.forbes.com/sites/forbestechcouncil/2018/04/02/visual-content-the-future-of-storytelling/#78c7ccfd3a46
[5] Stanford Web Credibility Research, https://credibility.stanford.edu/guidelines/index.html
[6] https://informationisbeautiful.net/
[7] Davis McCandless, The beauty of data visualization, TED Global 2010, https://www.ted.com/talks/david_mccandless_the_beauty_of_data_visualization
[8] Davis McCandless, The beauty of data visualization, TED Global 2010, available from https://www.ted.com/talks/david_mccandless_the_beauty_of_data_visualization